In this post we are going to customise metrics for Prometheus using the most common tool for exposing metrics, the postgres exporter It has been recently moved to the Prometheus Community repository, and it has been tested from Postgres versions 9.4 to 13, but also works as well for version 14.
This tool will help you to add visibility to your Postgres cluster, through which you can check how it behaves, and expose the metrics through the 9187 (default) port.
Metrics
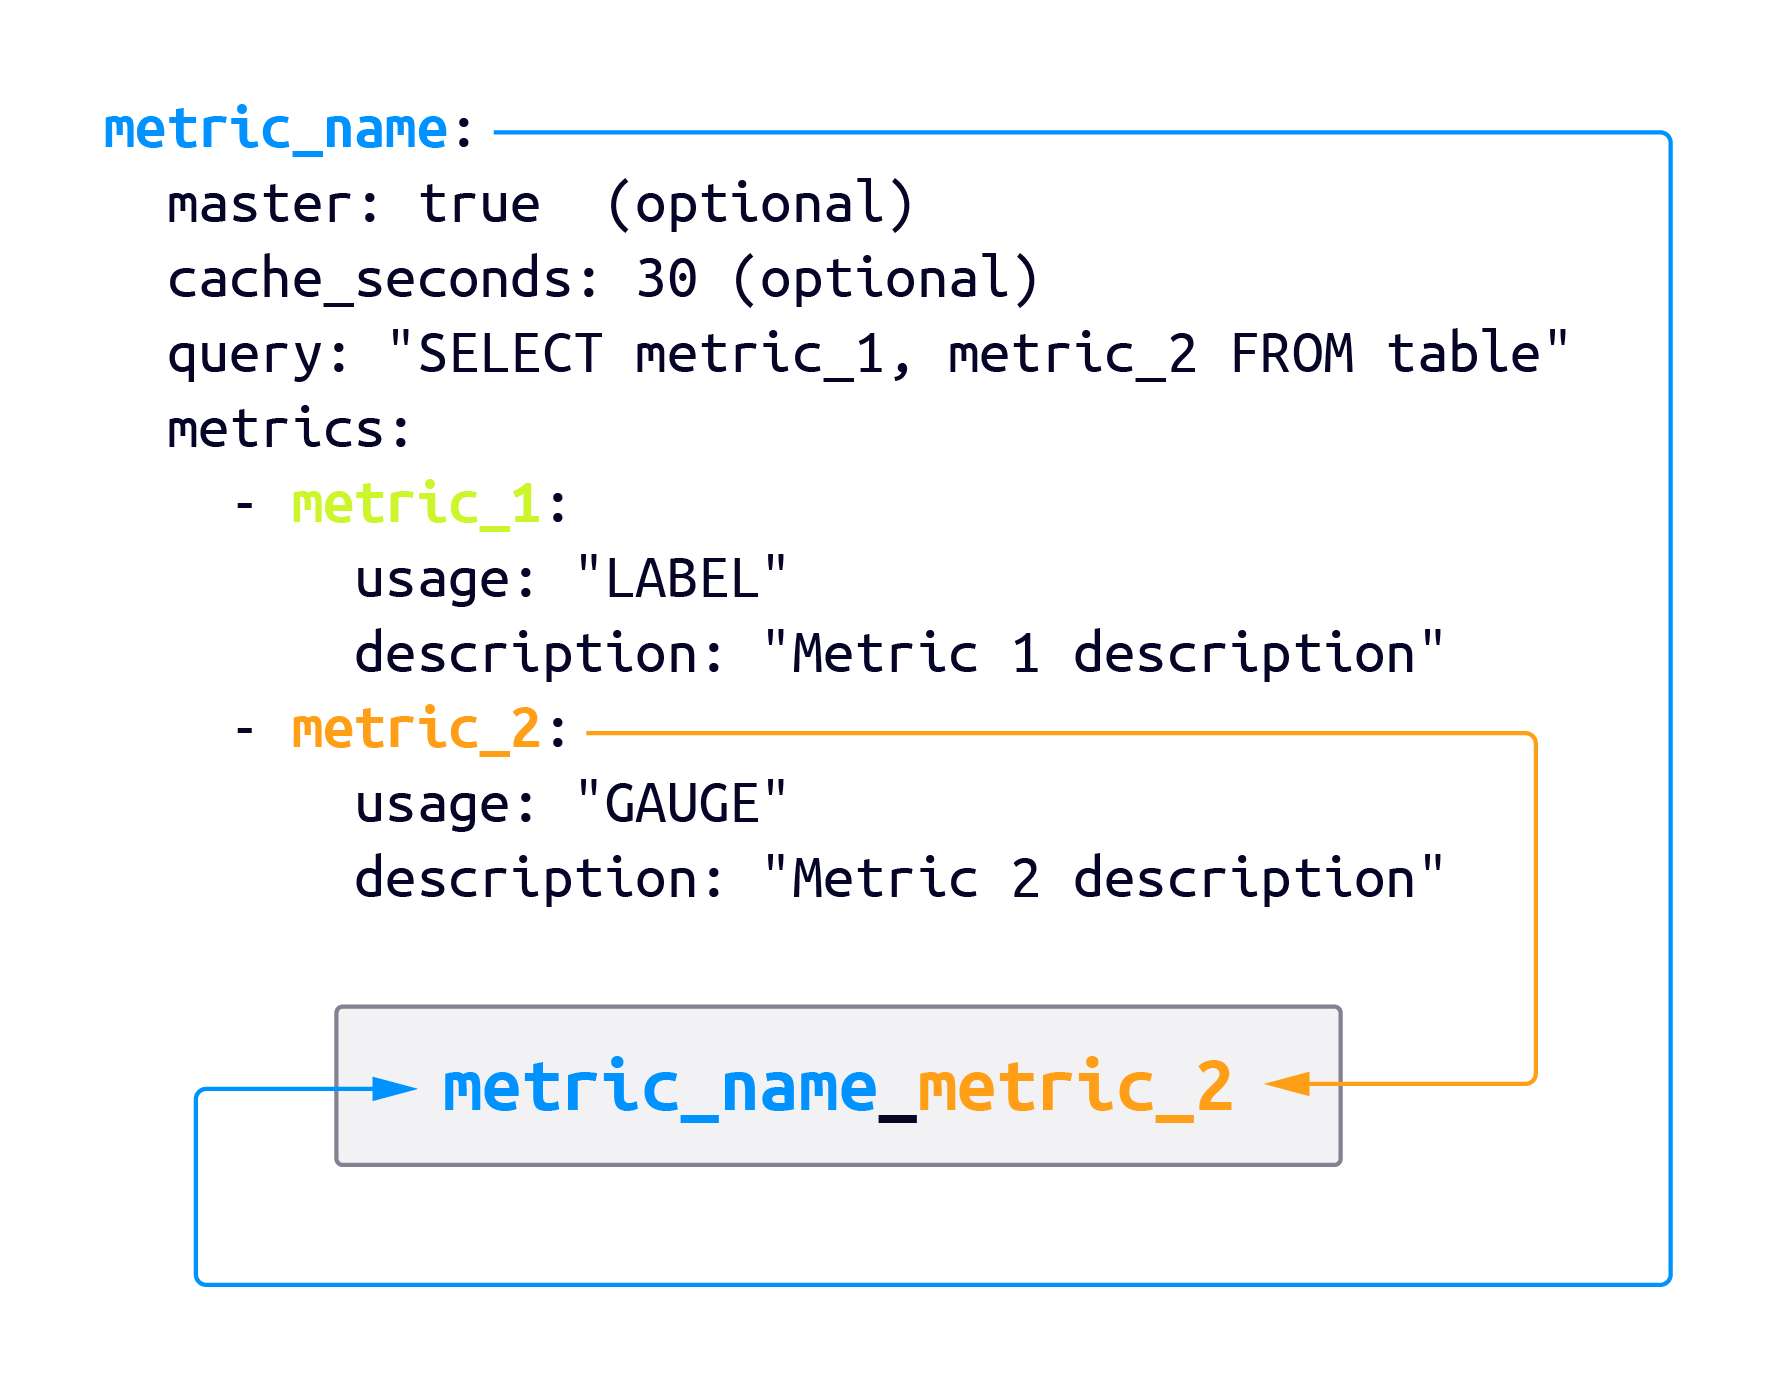
The postgres exporter has some defaults metrics and they are very helpful, but also gives you the flexibility of adding your own metrics using a yaml file. This yaml file must contain the queries to get the data you want to monitor and needs to have a specific structure:
metric_name:
  master: true  (optional)
  cache_seconds: 30 (optional)
  query: "SELECT metric_1, metric_2 FROM table"
  metrics:
    - metric_1:
        usage: "LABEL"
        description: "Metric 1 description"
    - metric_2:
        usage: "GAUGE"
        description: "Metric 2 description"
The structure is very simple and there are some consideration you need to know about each part of it:
-
metric_name: Simple as the name you want for your metric.
-
master: This value is often confused with the Leader host in a replication environment but what it really means is that the query will only be executed in the database configured in the
DATA_SOURCE_NAMEparameter. -
cache_seconds: The amount of time to keep the last value scraped before running the query again. Consider adding this parameter if the metrics data does not change very often.
-
query: Here goes your query definition and it doesn’t matter the complexity, it could be a simple or a very complex one just make sure the execution is fast. Each field returned by your query will represent a metric in the definition.
-
metrics: This is an array of each field returned by your query. Define it in the order as the query results and for each metric(field), you need to specify:
-
usage:
LABEL,GAUGE,COUNTERORHISTROGRAMthis will depend on the data retrieved and how you plan to show it in a graph. -
description: A short description of the data retrieved.
-
How the metrics are built and expose by the API:
Postgres exporter will expose the metrics making a concatenation of the metric name and the metric field:
Metrics with LABEL type are not exposed by the API because they will be part of the numeric metrics and they will be very useful to apply filters. This implies that there must be at least a numeric value (GAUGE, COUNTER OR HISTROGRAM) in every metric.
Metric definition:
A basic metric definition, could look like this:
pg_database_size:
  query: "SELECT pg_database.datname, pg_database_size(pg_database.datname) as bytes FROM pg_database"
  master: true
  cache_seconds: 30
  metrics:
    - datname:
        usage: "LABEL"
        description: "Name of the database"
    - bytes:
        usage: "GAUGE"
        description: "Disk space used by the database"
The example above will be shown as:
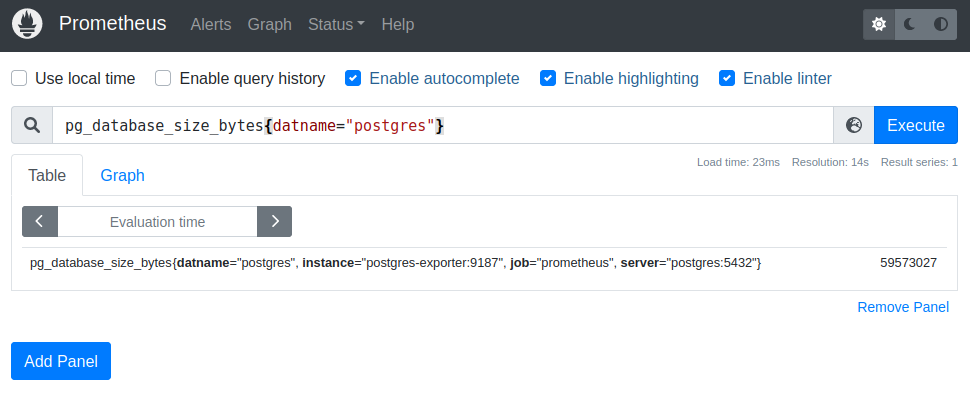
pg_database_size_bytes
Checking the metric from the postgres-exporter REST-API:
$ curl http://localhost:9187/metrics -s | grep pg_database_size_bytes
# HELP pg_database_size_bytes Disk space used by the database in bytes
# TYPE pg_database_size_bytes gauge
pg_database_size_bytes{datname="postgres",server="postgres:5432"} 8.758051e+06
pg_database_size_bytes{datname="template0",server="postgres:5432"} 8.602115e+06
pg_database_size_bytes{datname="template1",server="postgres:5432"} 8.602115e+06
As you can see, the metric also shows the information added to the definition, the TYPE and the description as HELP, and all fields with LABEL type are added to the metric between the curly brackets among others gathered from the environment.
Now check it from Prometheus:
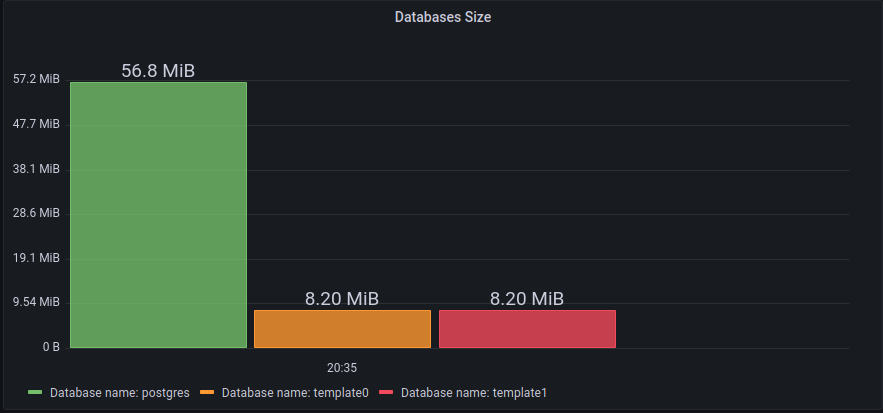
And a simple representation using Grafana:
This is only a very simple example of what you can do. Now check some takeaways about the postgres-exporter configuration.
Configuration
Depending on your environment you could have one postgres-exporter per postgres instance or one per many instances, you can define this in the DATA_SOUCE_NAME parameter with a comma separation between connection strings, check the two types of configuration:
Single instance
DATA_SOURCE_NAME: "postgresql://POSTGRES_USER:PASSWORD@localhost:5432/postgres?sslmode=disable"
One postgres-exporter for multiple postgres instances (NOT RECOMMENDED)
DATA_SOURCE_NAME: "postgresql://POSTGRES_USER:PASSWORD@host1:5432/postgres?sslmode=disable,postgresql://POSTGRES_USER:PASSWORD@host2:5432/postgres?sslmode=disable"
It is possible to configure a postgres-exporter to gather metrics from more than one postgres instance, but right now is not the recommended config due to an existing bug not solved yet that opens too many connections to gather metrics. Check the issue here.
It is recommended each postgres instance to have its own postgres-exporter, so you can monitor all the nodes in your fleets.
Business related metrics
It is quite common that it is needed to collect metrics related to business related information, such as number of users created in the last N hours, core business related processes sustained, etc.
All this can be added on each postgres-exporter service configuration. Sometimes, reporting or continuous aggregation queries are done in replica servers, and that’s where you may find suitable to place business related metrics, to move load out of the primary node.
Auto discover databases
To configure this option you need to set the next parameter:
PG_EXPORTER_AUTO_DISCOVER_DATABASES: "true"
Also you can combined it with PG_EXPORTER_EXCLUDE_DATABASES and PG_EXPORTER_INCLUDE_DATABASES
This option allows you to gather metrics from all existing databases or just a selection of them in the postgres instance. The databases are gathered from the pg_database catalog table from the database configured in DATA_SOURCE_NAME then a connection is open per database found. In environments with many databases per instance could be a problem due to the amount of connections used by the exporter. Check the reported issue here.
Query file
Use the parameter PG_EXPORTER_EXTEND_QUERY_PATH to add your custom queries.yaml file, the value must contain the path to your file.
Constant Labels
PG_EXPORTER_CONSTANT_LABELS will append the labels you set in all metrics. It is recommended to add at least one label that helps you to identify where your metrics come from like the cluster_name. It will be easier to filter them when you have multiple clusters.
Kubernetes
In a K8s environment the best approach is to add the postgres-exporter as a sidecar of your postgres pods gathering the metrics from the local container instance and exposing them to the API.
Due to all the perks it has, it’s been very well implemented in StackGres with a very nice dashboards created to fully monitor a database cluster.
Conclusion
The recommendations made in this post are based on the experience using the exporter and configuration made in on-prem environments and cloud environments. Not all the configuration parameters were mentioned but the important ones with some considerations. Postgres exporter is open source and a very useful tool to monitor your postgres clusters, don’t go blind and add visibility to your cluster.
Test it yourself
The next repository will help you to deploy a local environment to test the tools mentioned above, postgres, postgres_exporter, prometheus and grafana.